Overview
Leaderboard Graphs are an excellent way to keep track of performance both as a player and an admin. The Leaderboard graphs will give you insight into how the real data is tracking against the targets, and how many targets have been reached over time by both the team as a whole and on an individual level.
Why Use Leaderboard Graphs
As an Admin
As an admin, Leaderboard Graphs are a useful Coaching tool! Viewing how your team is performing over time against their targets is a good indicator of activity trends. See who is excelling in their tasks and reward them for their efforts, or gauge who may be trailing behind and in need of a little extra attention, self-confidence, and motivation. You can also get a feel for how YOU'RE performing as an admin! If none of your competitions are performing well in the graphs, you know you may need to have a look at your metrics and targets to make sure your expectations of the team are realistic and achievable.
As a Player
There are a couple of benefits to Leaderboard Graphs for players. First, by keeping up to date on your individual and team performance by making sure your activities are meeting the targets. Second, by keeping a cheeky eye on your opponents (erm, I mean Teammates) to see what you need to do to get/stay on top of the pack! Third, by using your individual graphs to discover coaching opportunities for yourself to present to your managers (after all, who doesn't love a bit of initiative).
Types of Leaderboard Graphs
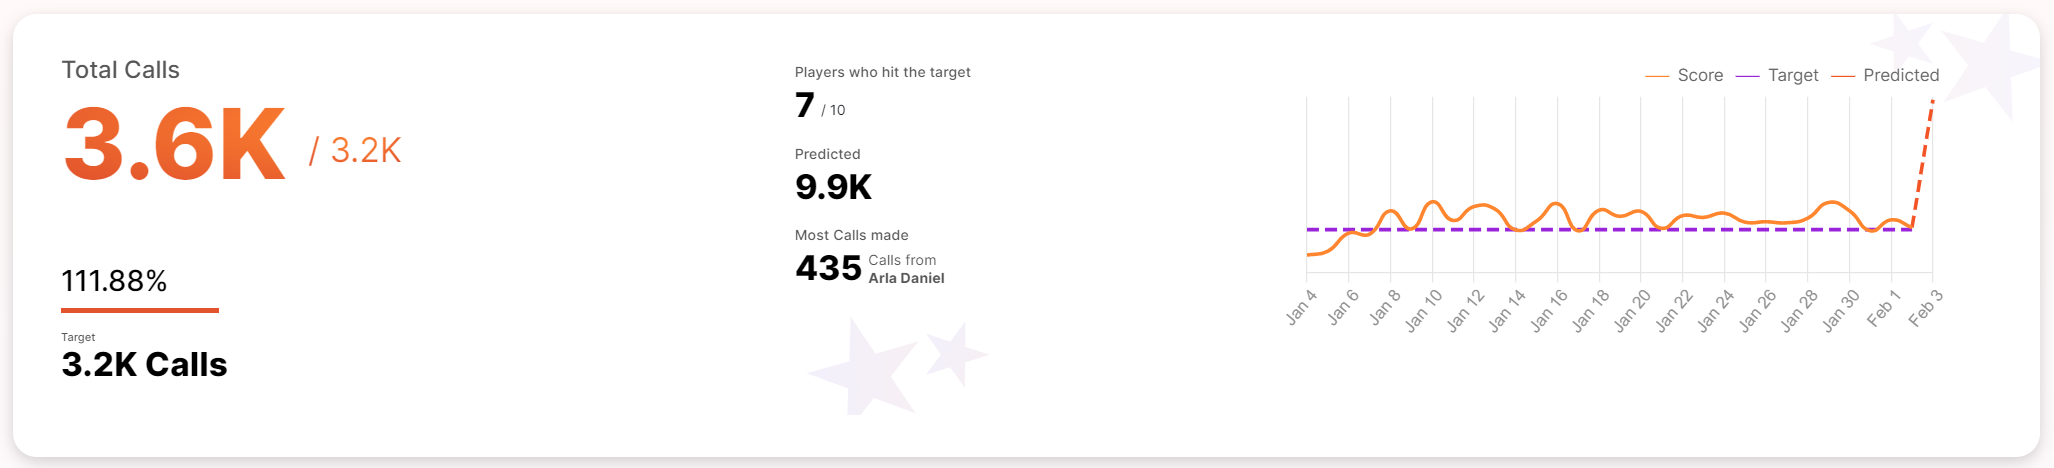
Overview
This section gives you an overview of how your current competition is tracking against the target, as well as over the competition lifecycle. You can also view predicted performance so you can easily check that your team is on track.
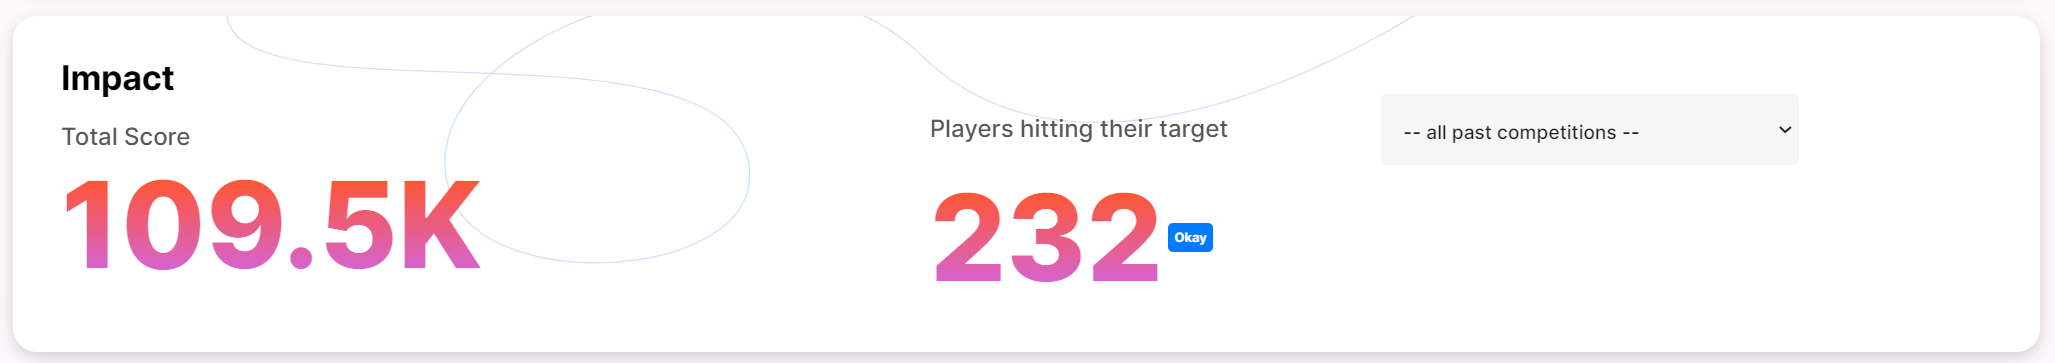
Impact
This section shows the impact the competition has had throughout the whole competition lifecycle. You can quickly view the total score and how many players have hit their target over time. You can also see an indication of whether the outcome is good, okay, or needs improvement.
Lifetime Insights
Lifetime Insights can be viewed by "Score" or "Hit Target Count". This section shows you key insights on how the competition is tracking over time. It's a good indication of whether your team is on track, or if the metrics associated with this competition need an adjustment. While Lifetime Score sparkline graph gives you a quick look at your team's progress to target over the lifecycle of the competition
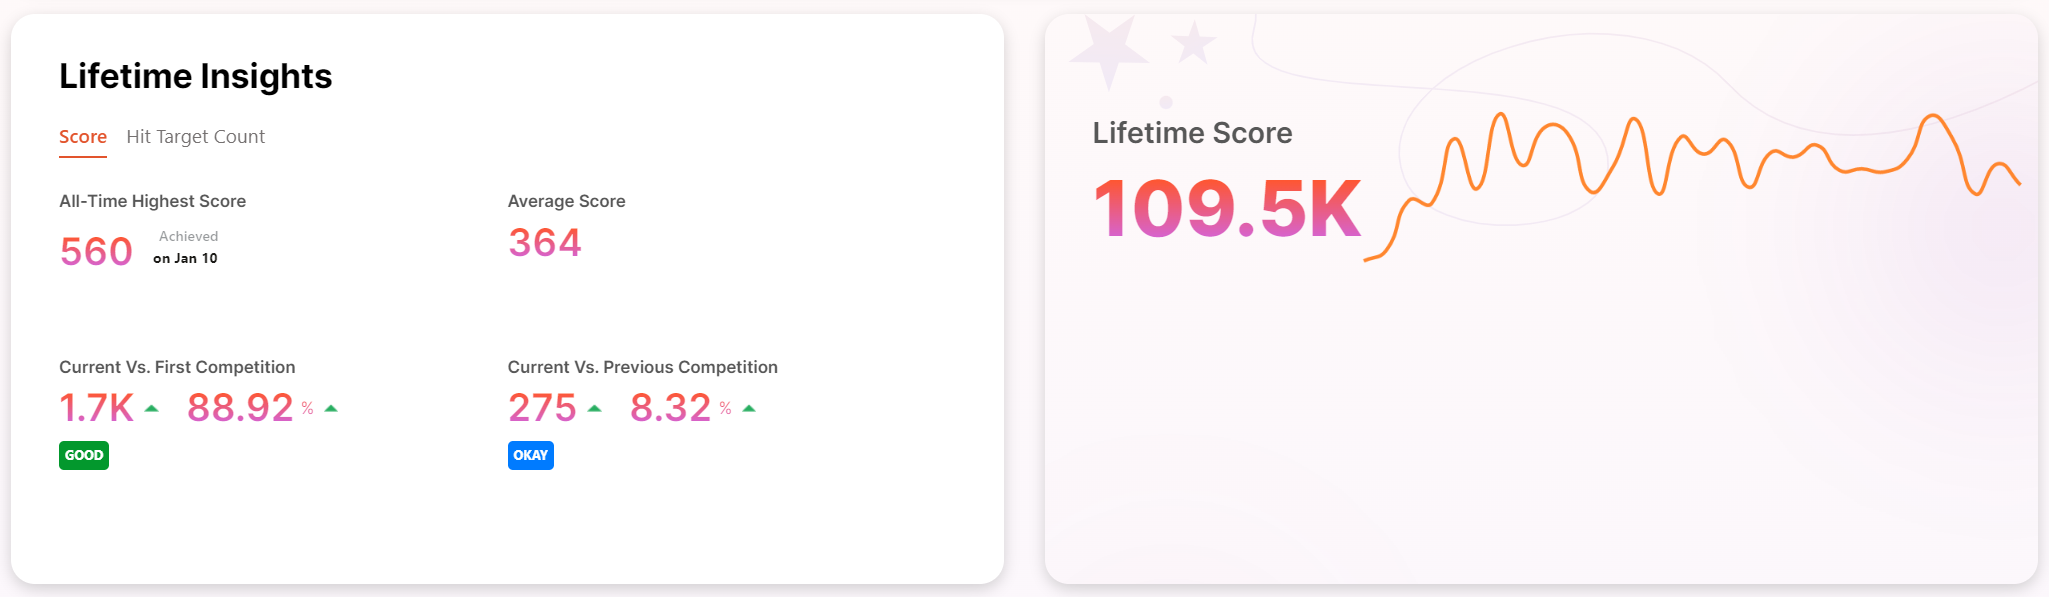
Average Score
As the name suggests, this section shows the combined average score of all your players

Player Insights
View the players' progress in the current competition, as well as overall. You can also compare the player with the next player in the leaderboard.
